
The debate over whether American public schools are failing to provide equitable resources to low-income and minority students has reached a fever pitch, fueled by a decade of conflicting research. While policymakers, activists, and educators frequently cite statistics to argue that school funding is profoundly inequitable, a closer look at the data reveals a more nuanced—and often contradictory—reality. Major research reports from institutions such as the Brookings Institution, EdBuild, the Urban Institute, and the Education Law Center often arrive at diametrically opposed conclusions, not because of flawed math, but because of fundamentally different methodological frameworks.
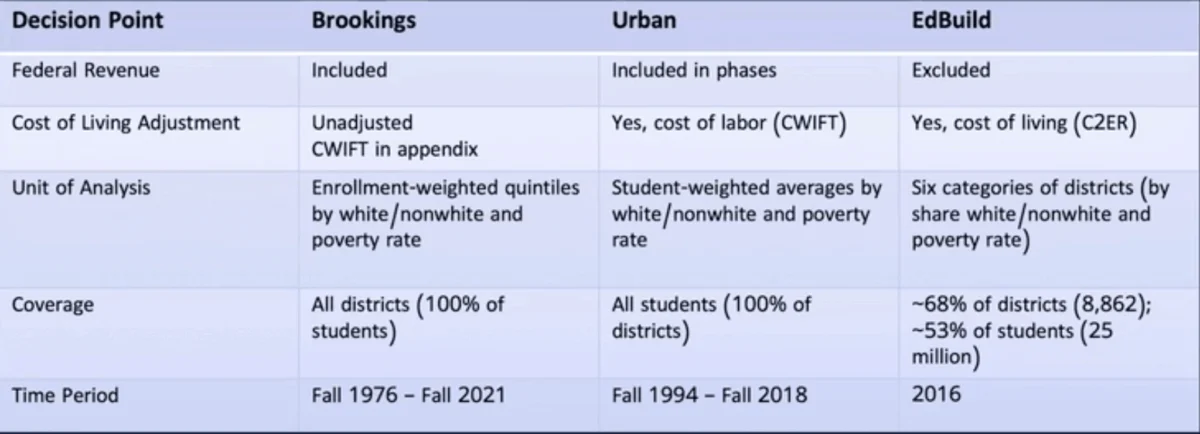
Understanding these discrepancies is essential for parents, taxpayers, and legislators who seek to determine whether the American education system is truly providing every child with the resources necessary for academic success. The confusion largely stems from three primary variables: whether federal dollars are included in calculations, whether figures are adjusted for regional cost-of-living differences, and how researchers categorize student demographics.

A Chronology of Conflicting Narratives
The discourse surrounding school finance has evolved significantly since 2017. For years, the prevailing narrative was driven by high-profile reports like the 2019 EdBuild analysis, which famously asserted that schools in predominantly nonwhite districts receive $23 billion less annually than their heavily white counterparts. This statistic became a cornerstone of advocacy efforts, frequently cited in national media and by civil rights organizations to illustrate systemic disinvestment in minority communities.
However, the landscape shifted in July 2026, when Brookings Institution economist Sarah Reber released a study that challenged the established orthodoxy. Reber’s research suggested that, contrary to popular belief, high-poverty and predominantly nonwhite districts have, for decades, spent as much or more per pupil than their more affluent counterparts. This report, updated in November 2026, sent shockwaves through the policy community, leading many to question if the narrative of gross inequity had been oversimplified.
The resulting tension prompted a series of expert forums, including an August 2026 webinar organized by the nonprofit EdFund. At this event, experts like Zahava Stadler, who previously directed policy at EdBuild and now leads initiatives at the New America think tank, emphasized that these researchers are not using "different calculators," but are instead answering distinct, policy-specific questions.

The Methodology Gap: What Gets Counted?
The most significant factor driving the disparity in findings is the inclusion—or exclusion—of federal funding. The federal government contributes more than $50 billion annually to K-12 education, including critical streams like Title I grants for schools with high concentrations of low-income students, IDEA funding for special education, and nutrition assistance.
When researchers at the Brookings Institution calculate per-pupil spending, they include all government revenue streams: local, state, and federal. By this metric, poor school districts often emerge as the highest-funded per pupil. Conversely, organizations like EdBuild, EdTrust, and the Education Law Center focus their analysis on state and local revenue. For these groups, the exclusion of federal dollars is a deliberate choice. They argue that federal aid is intended to supplement—not replace—state and local support. From this perspective, including federal dollars "obscures" the extent to which states are failing to meet their constitutional obligations to provide equitable funding.
The Urban Institute has provided a granular look at this phenomenon, demonstrating through layered data that while local property tax-based funding heavily favors wealthy districts, the addition of state and federal money can effectively invert the trend, providing more total dollars to high-poverty districts.

The Role of Regional Cost Adjustments
A second point of contention is the adjustment for regional economic differences. Because teacher salaries—the largest expenditure for any school district—vary wildly based on geography, a raw dollar amount does not reflect equivalent purchasing power. A salary that affords a middle-class lifestyle in rural Alabama would be insufficient in the San Francisco Bay Area.
Researchers who adjust for these costs often find that the apparent funding advantage in high-poverty, high-minority urban districts disappears. When adjusted for teacher labor markets and, in some cases, regional housing costs, the "extra" dollars in urban centers are revealed to have less purchasing power. This leads to a scenario where a district might spend more per student, yet be unable to hire as many instructors or support staff as a district in a lower-cost region. As Sarah Reber noted in her analysis, this changes the nature of the conversation from one focused on local property tax wealth to one focused on the high cost of urban labor.
The Divergence of Race and Poverty
A third, often overlooked complexity is that poverty and race are not perfectly interchangeable variables. While Black and Hispanic students are disproportionately represented in low-income populations, they are also highly concentrated in dense urban centers where labor costs are significantly higher. Conversely, many of America’s poor white students reside in rural areas where the cost of living—and therefore the cost of school operations—is much lower.

This demographic split explains why reports often show that while poor students receive more funding than their non-poor peers, Black and Hispanic students often receive less than their white counterparts. EdTrust, in its recent analysis, found that districts serving high populations of Black, Hispanic, and Native American students received $1,300 less in state and local funds per pupil than those serving white students, even as the funding gap for poor students appeared to narrow or favor the disadvantaged.
The Broader Implications for Policy
Despite the technical debates over methodology, there is a broad consensus among economists and education experts: the current system, while improved from decades past, remains inadequate. The mere existence of "more" money does not equate to "enough" money.
Educational advocates, including experts like Bruce Baker of the University of Miami, have long argued that the cost of educating students who face systemic disadvantages is inherently higher. To achieve equitable outcomes, schools in high-poverty areas require more than just standard instruction; they need robust investments in school psychologists, literacy coaches, tutors, and social workers. Simply matching the per-pupil spending of a wealthy suburb is often insufficient to close the achievement gap.

Furthermore, the "geography of opportunity" remains a massive, unresolved issue. The Education Law Center’s 2025 findings highlighted that a student’s total school funding depends heavily on their state of residence. A student in New York, for instance, may benefit from $17,000 more in annual per-pupil investment than a student in Idaho. This state-level disparity creates a baseline inequity that persists regardless of how one accounts for poverty or race at the district level.
Moving Forward: A More Critical Lens
The conflict between these major reports serves as a reminder that "school funding" is not a single, monolithic metric. For policymakers, the challenge lies in moving beyond headline-grabbing statistics to understand what the data actually represents.
When reviewing future reports, experts suggest three critical questions:

- Which funding sources are included? (Are we measuring state effort, or total available resources?)
- Has the data been adjusted for regional costs? (Does the funding account for the purchasing power of the dollar in that specific market?)
- Who is being compared? (Are we analyzing the distribution of funds by poverty level, by race, or by district property wealth?)
As the debate continues, the focus must remain on whether the current funding structures—regardless of how they are calculated—are truly providing the necessary tools to bridge the opportunity divide. While economists may continue to debate the methods, the lived reality of students in under-resourced schools remains the ultimate barometer of success. The complexity of these reports should not be used as an excuse for inaction, but rather as a roadmap for more targeted and effective legislative reform. The path toward educational equity requires not just more funding, but a deeper, more sophisticated understanding of where those resources go, how they are spent, and whether they are sufficient to overcome the profound structural challenges facing America’s most vulnerable students.